Updated 7/9/11
Any one of these issues is a serious problem, but all of them happening at the same time is a signal that the Arctic is destabilizing on a massive scale. Readers unfamiliar with the climate science should note, for example, that the break down of methane clathrates on the sea floor was not expected to begin for a century at least. Just a few percent of these clathrates being released into the atmosphere can give a boost to warming that may leave us powerless to arrest the process. We are playing Russian Roulette with civilization in allowing the Russian Arctic clathrates to dissolve into the oceans and the atmosphere.
I've been feeling all season we are going to have a large drop off in ice volume this year and the season so far is backing that up. The sea ice has been growing thinner, and falling in total volume for five or six years without exception. Even as ice extent, how spread out the ice is, seemed to "recover" after 2007, the actual amount of ice has kept falling. This means the ice has been getting thinner and thinner with less and less old ice - thick ice - remaining each year. The old, thick ice is key to avoiding an ice-free Arctic Ocean. It acts as a sort of anchor for new ice each year and reduces the amount of solar insolation by keeping some of the water covered so the sun's energy is reflected back out to space. With less and less of this ice, more and more of the open water is exposed each summer, leading to even more warming of the ocean and the atmosphere as heat is exchanged between them directly, and more so by the transformation of water to ice. There is a large pulse of heat out of the oceans and into the atmosphere each Fall as the sea ice forms. This warm air coming out of the warmed sea water, and combining with the warmer water, is affecting the formation of sea ice causing it to form later than usual, thus having less time to thicken, making it more vulnerable to melting the following summer. As Mark Serreze has stated, a death spiral.
My pessimism this year is based on all the points raised earlier, but key are the findings that the ice was in such poor condition when directly observed; the steady reduction year over year of total ice volume, which indicates the sea water is warmer than expected since 2/3 of ice melt is from below rather than above; the very large losses of old, thick ice; and the very late growth of sea ice last Fall. Some areas of the Arctic and areas of Canada did not cover with ice until December when they would usually be covered with ice by the end of November. The late growth was eventually reflected in a new record low total ice extent in the winter. The ice extent has been, and remains, below the record lows for most of the winter, spring and summer, as reflected in the following graph.
 |
| Arctic Sea Ice Extent from the NSIDC. The current extent is just below the extreme lows of 2007. Barring a shift to cold, calm weather for the rest of the melt season, we appear to be headed to a new record low extent, and almost certainly a new record low of total ice volume a new record low of old, thick ice. It's important to note the extent is 3 or 4 standard deviations from the baseline. in terms of the Bell Curve, this is well out on the tail. Statistically, this is a very large deviation, i.e. very abnormal. |
The opening of the Northwest and Northeast passages give us a simple proxy for the state of the Arctic Sea Ice. That they are open at all is a large anomaly, that both have been open in recent years is a huge deviation from normal conditions. They are opening for a longer period of time each year. Last summer they were open long enough for two different ships on different expeditions to circumnavigate the Arctic Ocean. This year, I expect a new record with both opening this month, and likely by the middle of the month.
An important regional effect comes via the
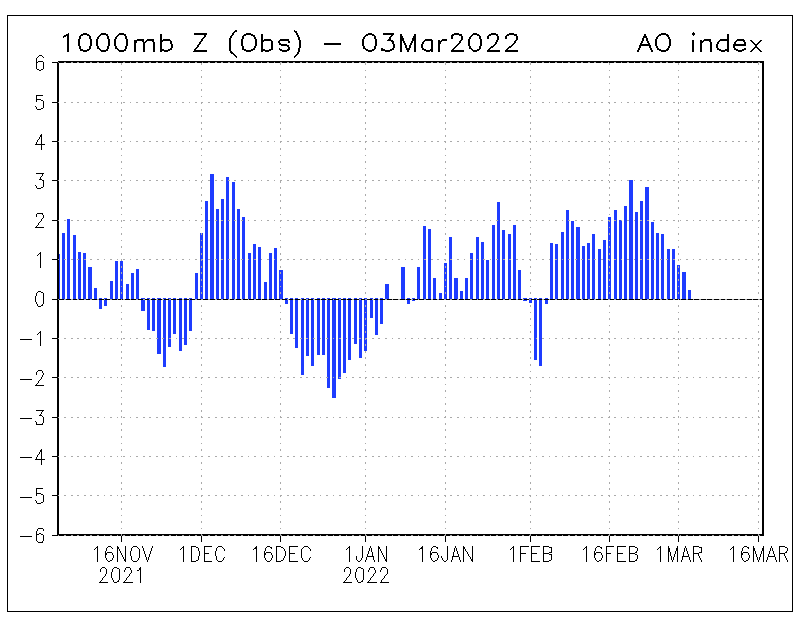
Arctic Oscillation, which in its negative phase tends to disperse cold air to the lower latitudes and brings warmer air into the Arctic. The AO is currently in a negative phase, which may be enhancing the current melt. The nice thing for me? Where I live, we get a fairly direct effect from the AO, which is likely keeping temps from being hot. In fact, I casually track the weather patterns and they seem to have a near-perfect fit to the AO here. We're warm right now, but not hot. I'd rather be hot and have a cooler Arctic, though. And nothing lasts forever. When the AO goes positive, it's going to get very warm.
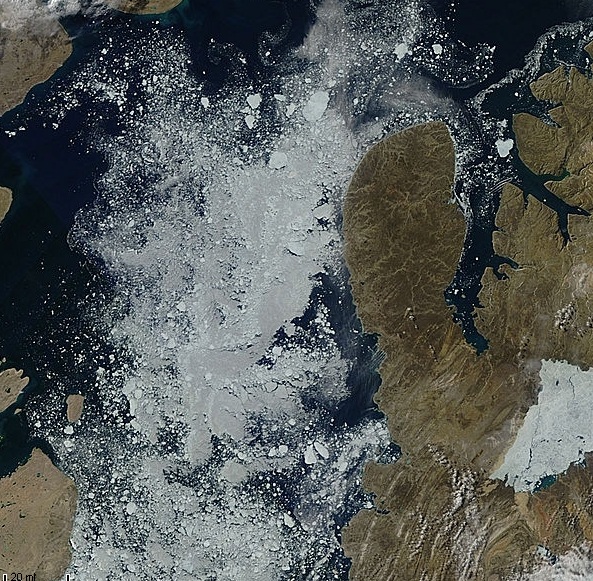
The following images show the western end of the Northwest Passage through the Canadian Archipelago. All the broken up ice and cracks you see in the channel have occurred in about the last week, so break-up seems to be picking up speed. The first image shows the sea ice as it had been, roughly, for weeks. It had slowly been breaking off small chunks and backing away from the open ocean. That process accelerated suddenly after the 27th of June which coincides with the beginning of a steep move into the negative AO, as you can see above. UPDATE: I read somewhere today, probably on Neven's site, that the AO is going more strongly negative for the immediate future with a strong high over the central Arctic Ocean. I would expect this to exacerbate the sea ice melt. July is commonly the month of greatest melt.
 |
| Western end of the Northwest Passage 6/27/11 |
In the image from 6/29, the area of breakup has nearly doubled. Cloud cover prevents us from seeing the condition of the ice further down the channel, but it likely had visible cracks indicating where the next breakups were going to be.
 |
| Western end of the Northwest Passage 6/29/11 |
You can see the area has again nearly doubled just one day later. There are cracks further back which you can see between the obvious last large crack and the thin passage in the upper left of the photo.
As we will see, the breakup continues along those lines.
 |
| Western end of the Northwest Passage 6/30/11 |
Here there is little change as wind and/or currents appear to have pushed the ice to the south, closing the cracks a bit. One of the difficulties in predicting sea ice is that it is inherently unstable and capricious. Winds and currents regularly push the entire Arctic ice floe one direction then another. Thus, it is entirely possible the NWP and NEP could open and close repeatedly during the summer, and be open or closed at different times.
 |
| Western end of the Northwest Passage 7/01/11 |
In the next image we see that the ice appears to be stable - those cracks still haven't opened - but in fact, new cracks beyond the narrow passage at the top have developed and foreshadow significant breakup to come.
 |
| Western end of the Northwest Passage 7/02/11 |
Not much change here....
 |
| Western end of the Northwest Passage 7/03/11 |
but then it all comes apart. I suspect that the breakup will accelerate once the elbow has been turned and the NWP will be opening up not long after. Depending on the weather, of course. Remember, however, the ice is very thin and vulnerable.
 |
| Western end of the Northwest Passage 7/04/11 |
We have to look at the other end of the passage, also. The first image below is the eastern end of the NWP on 6/30. The ice had been stable in that general area for weeks. There are several islands in the channel at this point, and it is where the channel opens up from the narrower passage between here and the open sea further east. I believe the islands played a role in keeping this ice locked in place, but once the ice disintegrates beyond the islands the pace may increase. Note the areas of grayish ice. Those are areas where the ice has already begun to break free and where future breakup can be expected.
 |
| Eastern end of the NWP 6/30. |
Here we can see the breakup beginning with the little peninsula and some ice to the left of the channel breaking up. Again, note the gray areas.
 |
| Eastern end of the NWP 7/2. |
Here we see significant cracks forming left and further up the channel in preparation for disintegration.
 |
| Eastern end of the NWP 7/3. |
And here we now see cracks all across the channel roughly along a line drawn from the corner of the island on the right and upward and over to the islands on the left. I think we can expect significant break up over the next week or two. Perhaps the interplay of the breakups at both ends of the channel will accelerate both.
 |
| Eastern end of the NWP 7/4. |
UPDATE: The area is showing signs of rapid breakdown just a day later:
The following two images show the full length of the channel. (NOTE: the channel is only part of the NWP.)
 |
| NWP along the Canadian Archipelago 6/26. |
 |
| NWP along the Canadian Archipelago 7/2. |
As stated earlier, I consider the NW and NE Passages to be proxies for the Arctic Sea Ice overall. One reason for this is that the oldest sea ice is supposed to be along the Canadian Archipelago in the Arctic Ocean, yet, this passage is opening every year. I'd think the narrow passages would encourage retention of sea ice since it should be difficult for it to flush out. Perhaps this assumption is wrong and the channel acts to accelerate water flow through it. Also, once the ice melted out several years ago, most of the old ice would be gone from the channel with little or no old ice floating around to help refill the channel leaving it vulnerable in subsequent years.
UPDATE: The Northeast Passage ice is showing rapid mass and extent loss, as is much of the Arctic Sea Ice the last couple days. Here's an image from July 8th:
It's looking very much like a race to see whether the NW or NE will open first, but right now it looks like the NEP has a good lead over the NWP.
EDIT: Looks like the supposition of old ice being flushed out was correct:
 |
| This image shows ice is not static. Any ice that survives the summer becomes multi-year, thicker ice. The key to rebuilding Arctic Sea Ice is for that to happen year after year. At this point, we are losing too much ice each summer, and because we are losing so much, it moves about more than it used to allowing more old ice to find its way out of the Arctic Ocean or adrift where it will more easily melt. Hat tip to Neven via Tenney. |
Perhaps the heat retained by the islands or water flowing off of them plays a role, too. Whatever the case, since it first opened up, it has continued to open each year and I see no reason why it would not continue to do so.
Consistent with this, we have seen new lows in ice volume nearly every year, and 2007 - 2010 have been the four or five lowest years on record for volume and extent since tracking began with satellites in the late '70's. With the continued thinning year after year, the huge loss of old, thick ice, the late freeze last fall/winter, the record ice extent lows over the entire cold season and up to today, and the nearly open NW and NE Passages now, I have a very hard time not seeing a new record low for both extent and volume.
Here is a view of the entire Arctic Ocean, with annotations.
 |
| Arctic Sea Ice on 7/3/11. Some areas are obscured by clouds, but are considered open (by me) based on previous observations. Some areas of "open" water contain ice, but not enough to prevent navigation, imo. The NWP and NEP are roughly 70% and 80% open, respectively. |
I'll be very surprised if both passages are not open by the end of the month, and see a 50/50 chance they will be open in the next two weeks. At minimum, all the ice should be broken up, even if not flushed out, and may be navigable. (The resolution on these images doesn't give a clear idea of space between ice floes/icebergs.)
UPDATE: The ice bound up along the Alaskan/Canadian coast has moved offshore, opening the passage. This leaves, at least for the moment, only the ice in the Canadian Archipelago between an open and closed Northwest Passage.
The images above were taken from
here. It is an interactive image you navigate like Google Earth. you can zoom in and out and drag the image around. You can also double-click anywhere to zoom and center the image at the same time. These images have the highest resolution I have found. Learning to tell clouds from ice takes a little attention in the beginning. Because it is not radar, you can't see areas covered by clouds. I encourage you to explore the sea ice to see for yourself the desperate condition it is in.