Updated 8/12/11
3:18 pm ET
UPDATE 8/12/11Despite the negative AO and high pressure, the Arctic has been pretty cloudy (aren't high pressure systems supposed to be mostly cloud-free?) which is probably helping keep melt moderated, though the rate of melt is typically lower in August than the preceding two months.
The sea ice continues to be spread out like a fan all along the western half of the ice pack. The wind patterns seem to be almost opposite of 2007, which is good, because I think if we had 2007 weather we'd be setting massive new records this season. As per this original post, I'm almost certain we'll see new lows in area and volume. I assume being spread out enhances the melt process due to more ice edge being exposed and warming of the sea water underneath from the insolation. The area marked in red is about the same area, +/-, as 2007.
 |
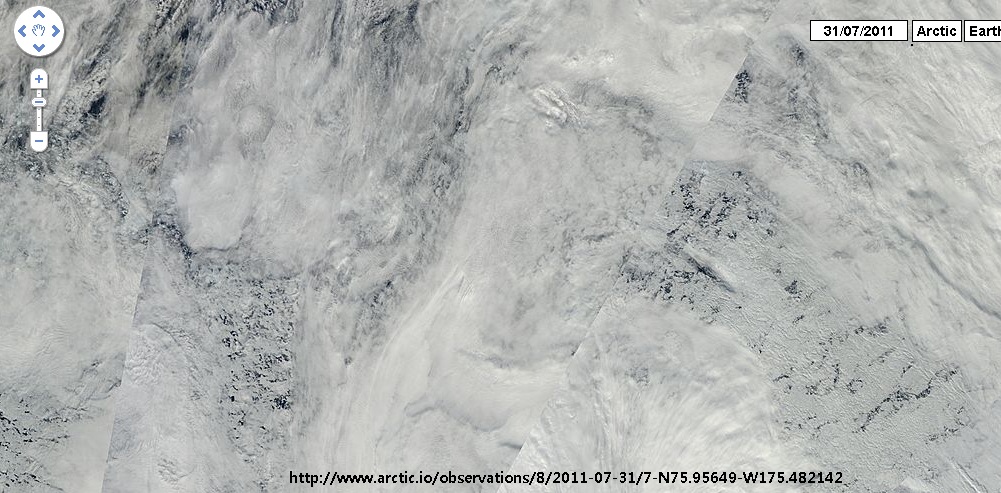
| Arctic Sea Ice from MODIS via arctic.io. The red line is the main ice edge; blue is weak "cottage cheese" ice; black is relatively sparse; and yellow is very spread out ice floes. |


Here's a another nice graph.

My comments posted at RealClimate prior to July 25th seem to still be accurate:
A. If weather is strongly supportive of ice loss, a 100% chance of new minimum in volume, and 95% chance of new minimum area and 90% chance of new minimum extent.With a negative AO since I said that - though that's not really strongly negative, more like generally or moderately negative - we've seen significant changes in the ice. I'm certain now there we will see a new ice volume low, and think area is edging upward from 95%. I am a little more doubtful of a new extent low unless the wind direction changes significantly and squashes all the ice together - of course, that would also enhance transport out of the Arctic and into the north Atlantic/Greenland Sea, so not a good thing for the health of the ASI - volume and area are better indicators of future conditions, anyway, so a non-record low extent won't mean much.
.
I'm amazed at how spread out the ice is, though. This just goes to show that predicting ASI is a lot like picking football games for your favorite team, at least for me: picking individual games, particularly against the spread, is hard, but it's relatively easy to pick the overall season.
The original post is after the jump.
Caveats
It is late to be making predictions about the Arctic Sea Ice (ASI) minimums (area, extent, volume), but I always resist doing so earlier in the season because of the large natural variation year to year. The years are getting more volatile. I did say months ago I was expecting to be near or to pass the extent record minimum reached in 2007, and that I was reasonable sure we'd set a new record low for volume if trends continued. Anomalous events are always the easy out on predictions. The rate of melt seems to have slowed significantly during July. The Arctic oscillation went positive and it was cloudier. Will that be enough to prevent a new minimum?
Setting the Context
In the first post in this series, I covered briefly some of the influences on ASI this season, including:
They include the general fact of the dynamics of climate change that the Arctic will warm faster than the rest of the planet, a scenario in which the Arctic is ice-free by 2016 +/- 3 years, the finding that most sea ice melt is from the bottom up because more water from the Pacific and Atlantic is getting into the Arctic Ocean than previously understood (and into fjords and under ice shelves adding to Greenland and Antarctic melt), observations of melting permafrost across the Arctic for a long period of time, the 2007 report of expansion of thermokarst lakes by a factor of three over just a few years and the resulting increase in methane emissions from them, the discovery of plumes of methane bubbling out of the Arctic Ocean floor along the Siberian Arctic continental shelf, an ice assessment aboard a ship that did direct observations that found what was believed to be heavy pack ice was ice that they could steam through at regular speed , and the expectation that the sea ice melt back would have an effect up to 1,000 miles inland.More immediate to this season, last year's melt season lasted quite late and the growth of ASI remained slow into December in areas. The (perhaps) logical conclusion is that the ice would be thinner this year having less time to grow. Such dynamics do not always hold with ice. It can grow very quickly. In this case, measurements in the spring found 1st year ASI 40cm thinner. It was not surprising to see the rate of ice melt in the spring was as much as 150,000 sq. km/day. Thin ice combined with warm temperatures from a negative Arctic Oscillation (AO) - a pattern of high and low pressure in the Arctic that pushes cold air south and brings more warm air north in the negative phase - was mostly negative from early May to mid-July.
Rotten Sea Ice - Extent
The first surprising significant melt of the ASI occurred in 2005. Certainly it was an anomalous drop, but it is clear the trend is strongly downward. We were in trouble long before 2005!

- only ten were larger;
- two were about the same;
- 14 were lower.
- five were larger drops than 2005;
- the combined decline over 1989 and 1990 was more than twice as large.
It is my non-scientifically tested contention that the period leading up to 1988 and the record global average temperature of that year marked a boundary for the climate system. The decade after that was marked by wildly swinging sea ice extents before settling into a new regime around 1998. That year was the hottest, by far, up to that point, in part due to a strong El Nino. I believe 1998 was a large enough temperature anomaly to break the system out of the wobbling regime and send it into the new state of rapid decline. Notice how the changes from year to year, though in steep decline, occur in a very narrow range compared to the previous decade. Draw a trend line through that graph from 1998 - 2005 and you will see the rate of decline has been much faster since then. But this period may not be the new state, but may have been the quieter time before the real shift to a new state.
Look at this longer graph of ASI Extent. Notice the differences in the periods up to 1952, from 1952 to 2006, then 2007. What changed in 1952? Nuclear bombs, maybe. The particles put into the air from nuclear testing might have blanketed the ice. Also, the world was recovering from WWII and industrial output was climbing. Perhaps most importantly, the signal from Greenhouse Gasses (GHGs
Rotten Sea Ice - Volume
Expeditions (1, 2) are finding very thin and weak ice where they expected to find solid ice floes and thicker multi-year sea ice is melting away and being transported out of the Arctic. Neven has a nice piece on this with other links, and a newer post on new research on ice thickness. From the paper quote at Neven's:
The fraction of total ice extent made up of multiyear sea ice in March decreased from about 75% in the mid 1980s to 45% in 2011, while the proportion of the oldest ice declined from 50% of the multiyear ice pack to 10%. These losses in the oldest ice now extend into the central Arctic Ocean and adjacent to the Canadian Archipelago; areas where the ice cover was relatively stable prior to 2007...The paper does go on to say there has been some recovery in multi-year ice since 2007 in some areas, but this doesn't jive with three facts: loss of the perennial ice pack in the central ocean, ice loss north of the Canadian Archipelago and the observed rotten ice. I fear much of this supposed recovery is in the form of what I call "cottage cheese" ice. This is not a scientific term and the whole idea is probably laughable, but I characterize it this way: as ice melts each year, not only is ice lost around the edges, but from all over. The ice pack actually moves around a lot due to winds and currents, etc., so the areas of static ice not actually static. Well, not anymore, because the ice isn't anchored, so the whole thing can move around. Because of this, it also spreads out more and develops more leads and polynyas. obviously, ice with open water all around it will melt faster than ice jammed together with other ice. When the ice freezes in the fall these open areas fill with first year ice. We end up with less contiguous areas of thick ice and more old ice cemented together with young, thin ice. The following two images show what I am trying to describe. As the snow melts away, we then can see the ice below, and see floes of ice in among what appears to be thinner ice.

Notice the ice isn't moving around in these images so much as just deteriorating. Note that the ice in the upper left looks solid, but as you move toward the lower right of the image the individual floes become increasingly visible. in the right image the same gradient applies even though the ice is much more deteriorated. it literally looks like the thin ice between the floes melts away and the larger, older floes then break up and melt away.
I suspect much of the Arctic Sea ice is like this, and, indeed, anywhere you look this is what you see. Maybe this is how it has always been?
Rotten Sea Ice - Slow as You Go
The rapid reduction in ice extent of the spring and summer has given way to much slower reduction in late July and early August.


 | ||||
| The two images above show rapid deterioration in the western Arctic Ocean from July 25th to July 31. |

 |
| These two images come show the quality of the ice in the mid western Arctic (between the US and Russia) has changed dramatically from the 25th to the 31st. |
 |
| Central Arctic Ocean on 7/24 and 7/31 show while ice extent was rapidly slowing actual ice loss appeared to be significant. |
Rotten Sea Ice - Sea Ice Area and Volume
A graph of sea ice area is less dramatic than the graph of sea ice extent:

The University of Indiana site, Cryosphere Today, tracks sea ice area and produces the following graph which can be dynamically linked, but is captured here. (Clicking on the image will take you to the dynamic graph.):

The PIOMAS chart indicates a very large loss of ice volume over summer 2010, throughout the fall and winter, and particularly into the spring, all setting the stage for significant melt this season depending on weather conditions.

More telling, the PIOMAS daily volume is clearly below 2007. The weather over the next six weeks would have to be hugely anomalous cool, cloudy and calm to avoid a record ASI volume minimum.
Rotten Sea Ice - In Hot Water
We've known for a couple years that warmer water from the Atlantic is infiltrating under the sea ice in the Arctic, Greenland Sea and related fjords/ice tongues/glaciers, but now it appears the ice is feeding on itself. A new study indicates the water from ice melt, colder than the ocean water at the surface, is pushing warmer water up under the sea ice enhancing melt.
What they found was a surprise — a layer of seawater about 200 metres below the surface that was actually colder than when it had been measured by previous expeditions.
“That's counterintuitive,” said Mr. Boxall. “We would expect to see, with global warming, warming conditions generally.”
But when they realized that the colder water was also saltier than they expected, an explanation began to suggest itself.
Mr. Boxall points out that the older sea ice is, the less salt it contains. Ice that's two or three years old already contains very little salt.
Year-old ice, however, remains fairly salty. And when it melts, it produces meltwater that's denser than the relatively fresh water from older ice.
As multi-year ice declines throughout the Arctic, more of the saltier meltwater from younger ice is mixing into the ocean. That colder, denser water sinks more quickly and forces less dense water from deeper in the ocean up to the surface.
Because fresh meltwater is colder than seawater, that means relatively warm water is being forced upwards. And that, said Mr. Boxall, may be part of the reason that sea ice is melting so much faster than anyone thought it would.The results are preliminary, but it helps explain things. I suspect the finding will be upheld.
Rotten Sea Ice - Rivers, Permafrost, Clathrates and Methane
Another piece of good news that may help explain why the Northwest and Northeast Passages are open every year now is the increased river discharge from the land areas surrounding the Arctic Ocean. Increasing rainfall and snowfall, which later melts and fills the rivers, are leading to warmer water flowing into the Arctic Ocean. This must be having an impact on near-shore ice.
Thermokarst lakes are another sign of a rapidly thawing Arctic. They have been found to be increasing, rapidly increasing methane emissions, which is enhanced by the sea ice melt, which in turn increases GHGs and temperatures... melting more ice. The frightening prospect from methane emissions is that the permafrost holds about 2x the amount of carbon already in the atmosphere. Do the math. We're nearly at 400 ppm CO2 and that is too much.
The warm water flowing into the Arctic from all these sources is very likely (understatement of the century) to be warming the sea bed where the methane clathrates (methane ice) lie. Methane measurements started rising in 2007 after trailing off for nearly a decade. The permafrost and clathrates play a role. The clathrates off of Siberia alone are already emitting as much methane as the rest of the world's oceans combined. There are clathrates in many areas of the oceans, but the Siberian clathrates are especially troubling because clathrates remain stable depending on a combination of temperature and pressure. In the deep ocean, even warm areas of clathrates will remain in place due to the intense pressure. On the continental shelf off Siberia, the ocean is only 50 to 70 meters deep on average. Combine that with the warmer waters and you have a serious problem. Worse, a recent paper found that the End Triassic Mass Extinction was fueled by methane.
Prior to this research, most scientists have believed that the sudden extinction of nearly half of all life forms on the planet was due solely to the emissions from volcanic eruptions that were occurring in what was to become the Atlantic Ocean. Ruhl et al contend that instead, what happened, was that the small amount of atmospheric heating that occurred due to the exhaust from the volcanoes, caused the oceans to warm as well, leading to the melting of ice crystals at the bottom of the sea that were holding on to methane created by the millions of years of decomposing sea life. When the ice crystals melted, methane was released, which in turn caused the planet to warm even more, which led to more methane release in a chain reaction, that Ruhl says, was the real reason for the mass extinction that led to the next phase in world history, the rise of dinosaurs.This is, hopefully, a long-term issue (but I doubt it.) How does all this affect the melt this year? Methane is a potent GHG. With methane in the sea water and in the air above the sea water, I assume there must be some localized effect on temperature. It seems reasonable to assume ice melt in the shallower areas of the Arctic are affected. Whether this is true, I am not sure, but at this point every tiny positive feedback is one tiny feedback too much.
Rotten Ice - AO and ADA
The lowest ice extent in 2007 was influenced by the weather patterns that year. Global weather patterns are largely effected by various oscillations in the climate system such as the AO, ENSO, PDO, NAO, ADA and other alphabet soup processes. We are concerned with the Arctic Oscillation (AO) and the Arctic Dipole Anomaly (ADA).
As noted several times in recent posts, the AO was negative for much of the spring and has now returned to the negative phase (the chart changes daily.) Forecasts are calling for a negative AO through at least mid-August. Recall this indicates higher pressure in the Arctic which should increase cold air flow out of the Arctic as air moves from areas of high pressure to areas of low pressure. We should see less cloudiness and higher temperatures while the negative AO lasts. We should see melt rates creep up. We may see above-average melt for August given the state of the ice in the comparative images above.
I can find no information on a current ADA. I assume it simply isn't developing. if that remains true, it argues for less ice being transported out of the Fram Strait and the Nares Strait than might otherwise occur.
Prediction - Review
These are my considerations and/or assumptions. They were covered above well enough and mostly do not bear discussion here:
1. Sea ice thickness is overestimated.
- Recent studies indicating overestimation.
- Direct observations and measurements from ships and aircraft
- Above-average temperatures
- Atlantic water influx
- Sea ice melt cold layer
- Increased river discharge
- Clathrate and permafrost melt
- Late onset of ice freezing last fall
- Early onset of melt this spring
- Long-term effects of melt from '07 - '10
2. The climate system is in heavy flux, some of which we do a poor job of accounting for:
- Anomalous weather events over the past 12 - 18 months
- Late onset freeze and early onset melt
- Patterns potentially indicating bifurcations in the climate records, e.g. discussed above
- Anomalously high temps despite low solar output
- At least a 2:1 ratio of new record high temps vs. record low temps
3. Measurements
- Sea ice volume falling faster than extent
- PIOMAS ice volume tracking well below 2007
- Sea ice extent at or near record lows for much of the last nine months or more
- First year sea ice in some areas measured at 40 centimeters thinner than last year
- Higher than normal temperatures
4. Possible Influences
- Dipole Anomaly - No sign of it developing at this time
- Negative AO for all or part of the remaining melt season (4 - 6 weeks)
- Positive AO after Mid-August and the remaining melt season (2 - 4 weeks)
Prediction - Caveat
I should make a distinction about what I am referring to as sea ice. As far as I know, ice in the Greenland Sea counts as Arctic Sea Ice, though I am not certain. If so, I disregard this ice as "Dead Ice Floating," i.e., this ice will not return to the Arctic Ocean and has essentially no impact on year-to-year melt. It does, however, likely impact melt on Greenland and discharge from the glaciers there, so long term, there likely is a positive feedback between overall ASI loss and Greenland Sea ice. For the purposes of my prediction, I am thinking of sea ice extent and area excepting the Greenland Sea. of course, the statistics are not kept this way, so it shall have to be determined by analyzing images. Ice volume and area will have to remain locked together with the Greenland Sea numbers.
Prediction - Analysis
This comparison of 2007 vs. 2011 shows the potential for record ice loss this season.
 |
| Images from Cryosphere Today showing the sea ice minimum in 2007 and conditions today. The red line indicates roughly the 2007 extent. The black line indicates the maximum melt I think we'll see under a worst case scenario. |
(It is worthwhile being cautious given the nearly static ice conditions in some areas of the Arctic over the past month. Though both the northwest passage and Northeast Passage are open, the Northwest Passage almost completely stalled in the Parry Channel. ice did break up significantly, but it was in no rush to vacate. The NWP is open via southerly, and very narrow, channels.)
A technical consideration is the ice area discussed above. I noted that the ratios of ASI Area anomaly remained roughly the same over the past two summers. August is the slowest month for ice melt. it makes sense the slower melt rate would mirror total melt. If this ratio holds, as said above, we will be nearly certain to see a tie for 2007, give or take a little, or a new record area minimum, for the same reasons stated for ice extent. The daily ice volume from PIOMAS very clearly indicates a record low volume is virtually certain.
With regard to ASI Volume, I think we are already locked into a new record. The weather would have to be very favorable to overcome the thinness of the ice given how close the 2007 and 2011 extents already are. With a negative AO in place in the near term, I see the chances of a new record volume to be 95%.
Prediction - Numbers
Arctic Sea Ice Extent = 4.2m km2 +/_ 0.2m km2
Arctic Sea Ice Area = 2.95m km2 +/_ 1.2m km2
Arctic Sea ice Volume = 5,500 km3 +/-500 km3
There's a LOT of Greenland Sea ice that was not there in 2007. If that is not included, I'd say new records are certain for area and volume.
No comments:
Post a Comment
Comments appreciated, but be polite; I like to edit.
Cheers