Showing posts with label sea ice minimum. Show all posts

Saturday, September 3, 2011

Current State of the Arctic Sea Ice: Arctic Sea Ice Predictions Update II

My Original Predictions

Arctic Sea Ice Extent = 4.2m km2  +/- 0.2m km2
Arctic Sea Ice Area = 2.95m km2 +/- 120k km2
Arctic Sea ice Volume = 5,500 km3 +/-500 km3
Numbers (approximate) @ 8/22:
Arctic Sea Ice Extent = 5.2m km2
Arctic Sea Ice Area = 3.269m km2
Arctic Sea Ice Volume = 6,500 km3
Current Numbers (approximate)
Arctic Sea Ice Extent = 4.5m km2
Arctic Sea Ice Area = 2.994m km2
Arctic Sea Ice Volume = 6,400 - 6,500 km3


Sea Ice Extent
The final 2007 minimum extent compared to the present make it seem doubtful a new extent record will be reached unless we have unusual heat and ideal weather for melt over the next two weeks. From Cryosphere Today:
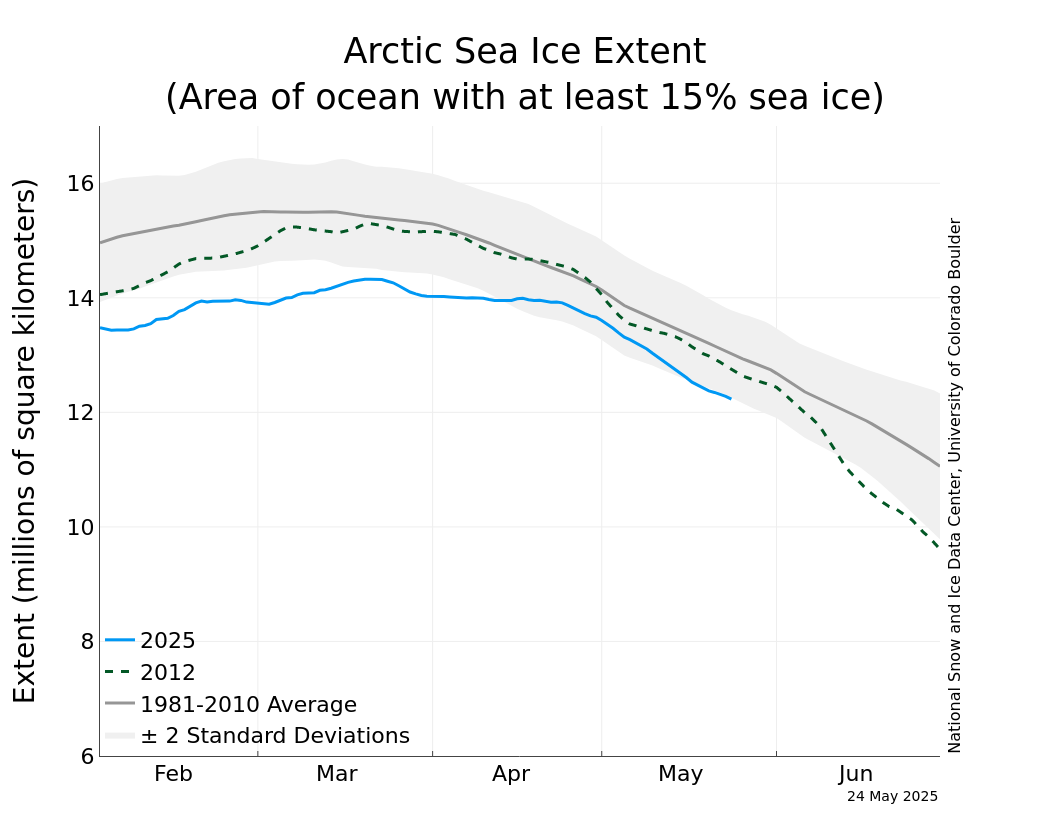
The NSIDC Extent graph shows '11 tracking '09 very closely with current extent roughly 4.5 - 4.6m sq. km.with 2 - 300k to go to match '07.
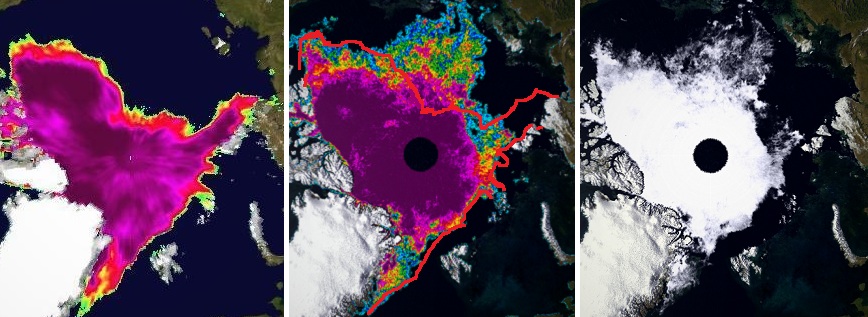
If melt continues down to where we see more compacted ice in the images above, a rough estimate of the areas of compact ice in the '11 images correspond well to the '07 extent, so we'll be looking at a near-record or new record, if so.

Melt Factors
The Arctic Oscillation (AO) is mildly positive
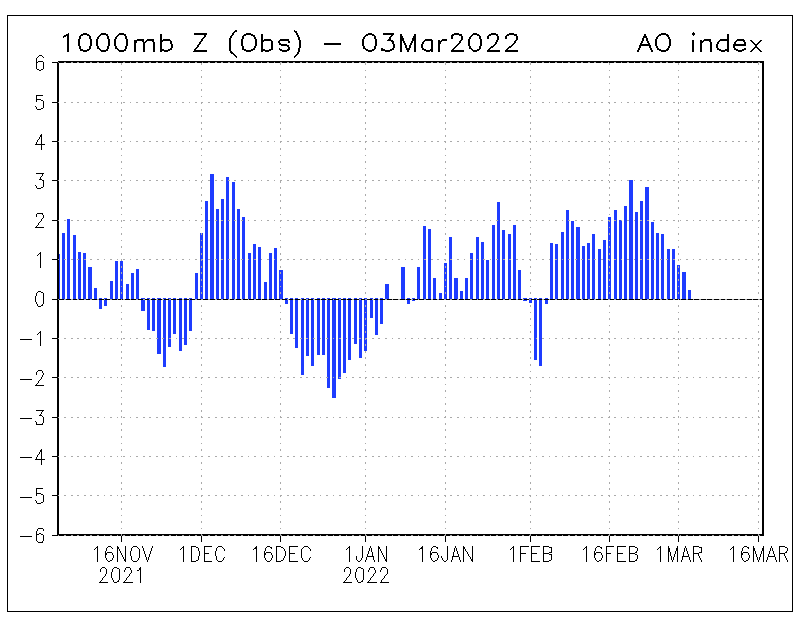
and expected to be mildly positive or mildly negative till the middle of the month which should help reduce ice loss. Current sea ice drift patterns seem to encourage ice loss and a possible reduction in extent. The large area of loose ice looks to be moving toward the center of the pack; given how loose it is, it could reduce to 1/4 its current area by rough estimate. The yellow box indicates an area of very little ice, also, appearing to be a place where sea ice goes to die this season. There also is a flow from both of Greenland toward the Fram Strait which would indicate significant transport out of the Arctic Ocean. These patterns can change quickly and may only be significant if they persist.

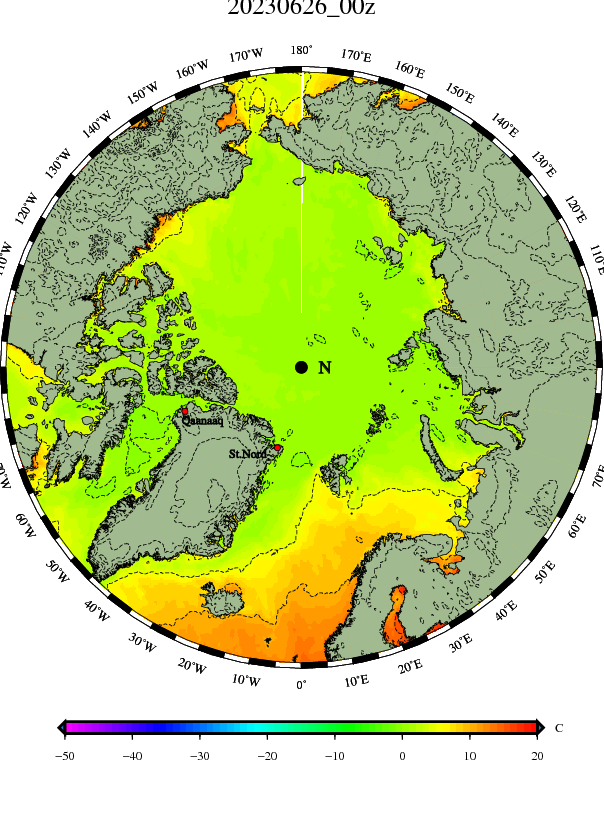
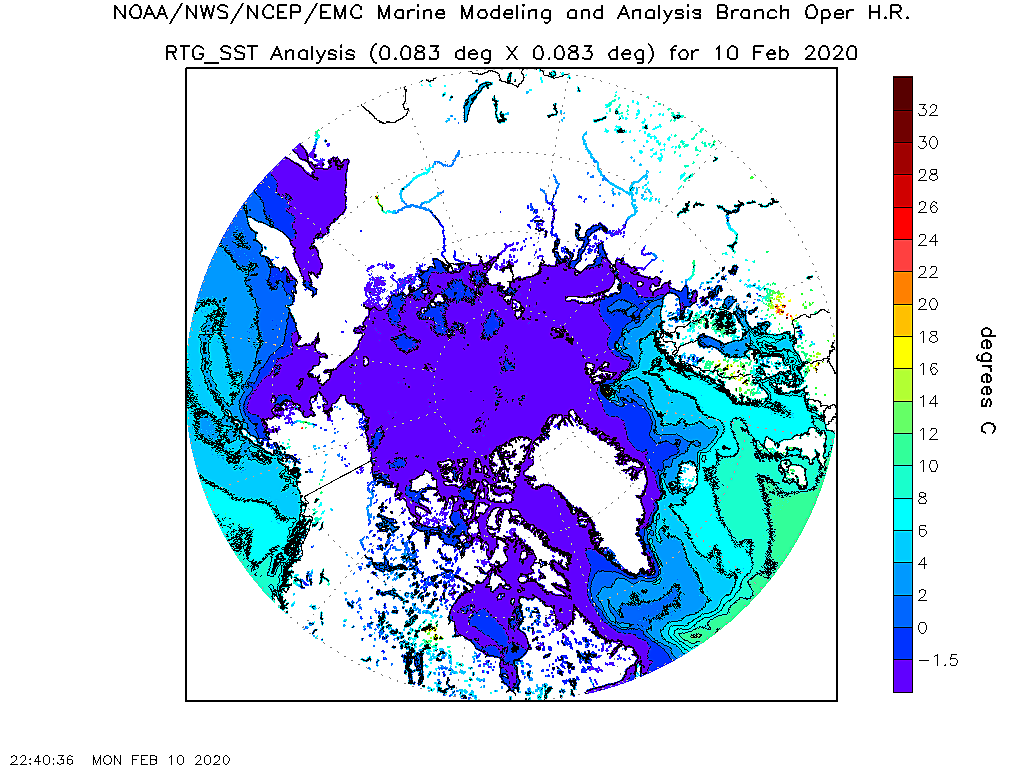
Air temps where the ice pack is sitting are hovering around 0C. Since sea ice is slightly colder than freezing, there is probably still a net melting effect from air temps. Sea surface temperatures look to be about ice temperature, but warm around the ice. I suspect also under it yet since the water around the ice pack is reading warmer than the ice, but in the area of the pack is reading about ice temp. Sounds like a sampling problem?
Sea Ice Area
This measure is more important than extent for assessing current state of the ice, but is more difficult to measure. Current analyses put ice area at or near the '07 record. The melt season could another 2 - 2.5 weeks. Even with favorable-to-neutral conditions for low melt rates, a new record here is almost a guarantee.
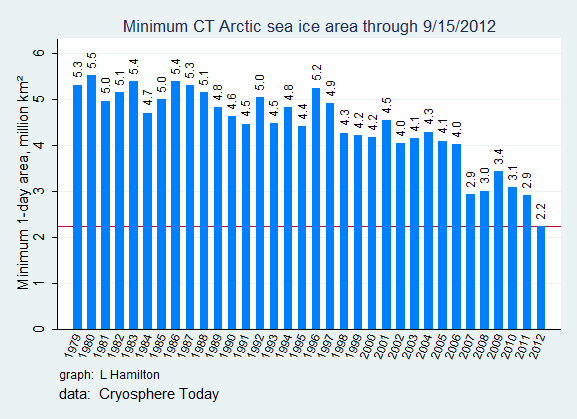
According to Cryosphere Today, ice area is already below 3 m sq km.
Ice area measures the total surface area of the ice excluding areas of water between floes. Given much of the ice around the edges of the main pack is very thinly distributed, and the ice is very thin, we should see enough melt to set a new record. less than 10k sq km /day will take area below 2.9m sq. km.

Sea Ice Volume
Sea ice volume is further from a record than area and extent are...

and this image from Sept 14, 2010 supports this.

PIOMAS does show ice volume already tracking below the '07 minimum.


The PIOMAS models should at least comparable to themselves year-to-year, but there are doubts about the new model as illustrated from comments at RealClimate's thread on Arctic Sea Ice.
I have reservations about the volume numbers and ice thickness models. The piomas version 2 model that was introduced this spring shows considerably higher thickness values. The navy, for example (http://www7320.nrlssc.navy.mil/hycomARC/navo/arcticictnnowcast.gif) reports two to three meter thick ice all around the north pole. Russian and American science vessels recently met at the pole and reported actual thickness of a meter or less.
Neven has info on a report from the Polar Stern as it reached the North Pole.
The first ice thickness measurements confirm this: in 2011 as well as in 2007 most of the ice has an ice thickness of 0.9 m.
A recent post from the polar Stern (in German) speaks of the condition of the ice as being very poor.  They are having a very hard time finding ice thick and intact enough to do their research activities.

The graph below from that post illustrates the thinness of the ice. Of course, anyone who has seen footage of Arctic ice, particularly from below, knows it is anything but one large flat ice floe. The ice gets squished together and stacks up in piles and ridges. What is interesting is that old footage used to show large blocks of multi-meter ice that was contiguous. Now images and film I see only shows jumbled up ice, as if the only thick ice exists because of ice motion and not freezing. The spikiness in this graph encourages me to consider this as a serious possibility.
 
Also, that spikiness is reflected in the images we see of the "cottage cheese" pattern of ice I have discussed earlier in which individual floes are surrounded by what can only be thinner ice.

Unfortunately, the MODIS images have been too cloudy to get a good look at the ice for a while. This radar image gives a fair sense of the ice and with more detail and accuracy than the Cryosphere Today images.


In fairness to PIOMAS, new models take time to calibrate and refine. If the changes they made this year are an improvement, I still think it is certain they are overestimating ice volume for now. Still, lower than 2010? Perhaps not. We didn't have a strong melt this summer.

It's a mixed bag. A probable new record in Ice Area, a slightly possible new record in Ice Extent and a new 2nd lowest Ice Volume. I do think the volume numbers are not  highly reliable and the first-had reports do indicate a likely new Ice Volume record, but that would also mean the numbers for 2010 volume were too low or that 2011 numbers are far too high. We may have to wait a year or two to find out.

Monday, August 22, 2011

Current State of the Arctic Sea Ice: Arctic Sea Ice Predictions Update

Post Content
Arctic Sea Ice Extent, Arctic Sea Ice Area, Arctic Sea Ice Volume, the Northwest Passage and Northeast Passage.


My Original Predictions
Arctic Sea Ice Extent = 4.2m km2  +/- 0.2m km2
Arctic Sea Ice Area = 2.95m km2 +/- 120k km2
Arctic Sea ice Volume = 5,500 km3 +/-500 km3
Current numbers (approximate):
Arctic Sea Ice Extent = 5.2m km2
Arctic Sea Ice Area = 3.269
Arctic Sea Ice Volume = 6,600 km2
Arctic Sea Ice Extent
The green line is roughly the minimum 2007 Arctic Sea Ice Extent; the yellow line indicates a rough guess for minimum 2011 Arctic Sea Ice Extent based on current areas of very low extent sea ice; and the orange and pink hatched areas are the areas of difference between the two years.
Images from UIUC.
This has been an unusual melt season in terms of extent. The area and the volume are tracking at record or near-record levels, yet the ice is very spread out. Obviously this indicates the ice is quite thin relative to historic, or even recent, conditions. Why is it so spread out?
  • Thinner ice is more prone to breaking up and once a chunk breaks off it will obviously drift.
  • Without getting too technical, let's say there haven't been strong or persistent weather patterns that moved the ice in any one direction, leaving it to drift into available space.
A brief Dipole Anomaly (2007 conditions) with a high set up in the area of Alaska then dissipated. Had this persisted we should have seen more ice transported out of the Fram Strait and the ice pack compact under a consistent wind regime toward From the Bering Strai/Sea region toward the Fram Strait.

As it stands, my prediction for Extent, just slightly more than for 2007, seems to have been low, and I can't remember why since I wasn't expecting a new record. There is an indication of another Dipole Anomaly setting up which potentially could accelerate movement of ice and ice loss via wind direction and higher temperatures. If a strong Dipole does develop, a new record is well within the range of the possible. The strong caveat comes from how spread out the ice is at this time.

Another consideration is the Arctic Oscillation (AO) which is generally predicted to begin moving toward neutral and possibly go positive by September. A positive AO is associated with cooler temperatures in the Arctic indicating slower, less or no melt is possible.Still, given there are as many as three more weeks of melt season left, we could see a new extent record.

Judge for yourself the state of the ice (Images taken from here.):
Image I
Image II

Image III

Arctic Sea Ice Area
Arctic Sea Ice Area from BPIOMAS.
This is a little more of a statistical analysis. I have looked at current conditions and the past two years and extrapolated. The black bars are the difference in area for this approximate date this season and the prior two compared to the long term mean. The red lines the difference in means for each year at the minimum for each year. As you can see, the anomaly difference can be slight as in 2009 or fairly large for 2010. The blue and green lines on the graph show what the ice area minimum will be if the anomaly right now remains the same, relatively, at the time of the minimum and what it will be if it is somewhere between '09 and '10.

The melt season, like pretty much all natural phenomena, is not linear. Over the past weeks this has been amply illustrated. We've seen Arctic Sea Ice Area decline slow, speed up and even seen the area increase. This pattern is probably more likely as the season comes to an end and the Arctic cools over all. Cooler days may see ice growth while warmer days will see it decline. The ice season also has no clear rhyme or reason; it could end in ten, twenty or thirty days.We are still looking likely to see a new record for ASI Area. This measurement tries to determine the actual area of ice, not ice and open water between floes as extent does, so it is a little less dependent on winds and currents for short term changes, though obviously weather and temperatures do drive changes.

I won't be surprised if we hit the low end of my error bar (2.83m km2) if conditions favor melt. As with extent, whether the Dipole Anomaly develops or the AO goes positive will make a difference, and potentially a large difference.

Arctic Sea Ice Volume
I have tried to mark estimate volume if melt slows (blue line, 5.4 cu. km) or continues the current trend (4.9 cu. km.) Again, it looks like my estimate may have been high, though within my range of error. The areas of low ice extent around the fringes of the main pack ice will be the key here. If we lose most of that and are left with a core of thicker ice as in 2007 we might hit a new volume record, but 2010 volume was extremely low at @4.5 cu. km.

Volume is the most important estimate, in my opinion, because it reflects all the forces affecting the Arctic Sea Ice: irradiance, air temperatures, sea temperatures, weather. It gives an excellent sense of the condition of the ice when there is divergence between extent and volume, for example, because you know the ice must be thinner if extent is higher than the record, yet volume is lower.

Northwest Passage
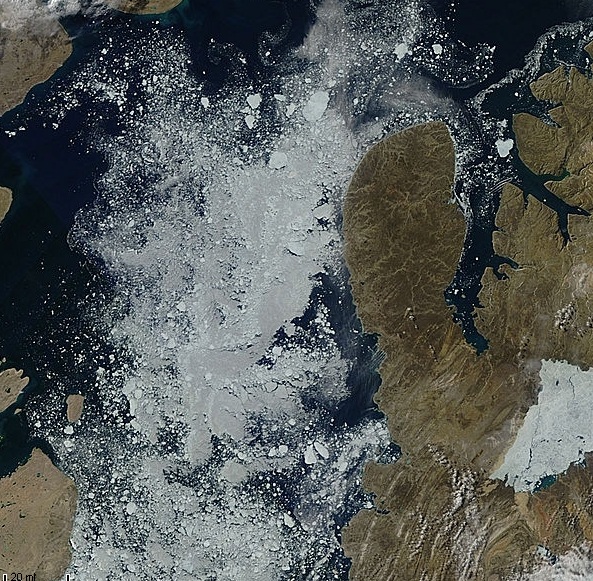
The Northwest Passage is filled with much at this point. Those white specks are the ice floes under the clod cover. The scale here is about 20 km./inch, so there is plenty of room to maneuver, though ice obviously should be treated with great caution.

 This image is from the 16th. You can see much of the really small mushy ice has melted away.


I'm not expecting the Parry Channel to clear completely, but it is clearly navigable. The southern route would be safer, but is longer by a good 300 miles.

Northeast Passage
Yellow lines outline clouds, blue lines ice.


This image from the 16th shows the ice more clearly. The ice has thinned considerably compared to the above image.

The key point here is that the both the Northwest and Northeast Passages are opening every year, and earlier each year. This illustrates the effect of thin sea ice. It takes very little energy and bad weather for the ice at the outer reaches of the Arctic to melt out. This year it was extremely early. The Northeast Passage was officially open for ice breaker-guided shipping on June 30th, and open, by my estimate, for traffic soon after that.